黃 鍔 院士,國立中央大學數據中心
講題:Global climate of different scales
摘要:Global climate change is a contentious issue. When we discuss climate change, we should realize that there is a time scale. Different mechanisms will drive climate change of different time scales, from 10^8 to 10^2 year time scales. Each had their controlling mechanisms, which will also be presented, analyzed and discussed.
汪中和 博士,中央研究院地球科學所
講題:由HHT探討台灣地溫變化的特性
摘要:本研究利用Hilbert-Huang Transform方法,分析台灣百年來地溫觀測站,在深度0、5、10、20、30、50、100、200、300、500cm的觀測資料。透過比較不同深度數據之瞬時振幅、瞬時頻率,計算熱能於地表下的傳導速率;並經由趨勢分析探討與氣溫全球及氣候暖化的的相關性。
王逸民 博士,逸奇科技股份有限公司
講題:趨勢訊號分離之原理及地球科學之應用
摘要:Time series signal contains many physical as well as artificial components that can only be perceived when separated. Generally signal is composed of four parts: trend, periodical, discontinuity, and stochastic signals. Without interference, trend is better separated using zero phase filter like Iterative Gaussian Smoothing Filter. Rather than spectrum analysis, periodical signal is better viewed in time-frequency plot due to its time resolution. The showing of frequency changing with time in time-frequency plot in many cases reveals abundant physical phenomena. However, due to various data acquisition conditions and maintenance procedures, quality of data sometimes is degraded by lots of discontinuities, resulting in poor time-frequency resolution and frequency contamination in spectrum analysis. In this presentation, several approaches are explored to remove discontinuity. Examples including strain meter and ground water signals showing significant improvements both in spectrum and time-frequency analysis.
李如晃 博士,經濟部水利署
講題:地下水之時頻分析
摘要:利用時頻軟體對受到海水鹽化之地下水觀測站井作頻譜分析,配合由中央地質調查所製作之地形剖面圖,可驗證濁水溪沖積扇之含水層大部分不與海水連通,所以地下水鹽化之主要成因為地勢低窪受到海水滲入或海水倒灌而導致;而屏東平原之地下水觀測站井之鹽化成因則可分為地層含水層與海水連通和受海水倒灌兩類,與地形剖面圖之結果相符。
蘇聖中 技 佐,中央氣象局地震測報中心、中央大學地物所、中央大學數據分析中心
講題:Hilbert-Huang Transform(HHT)資料分析初探
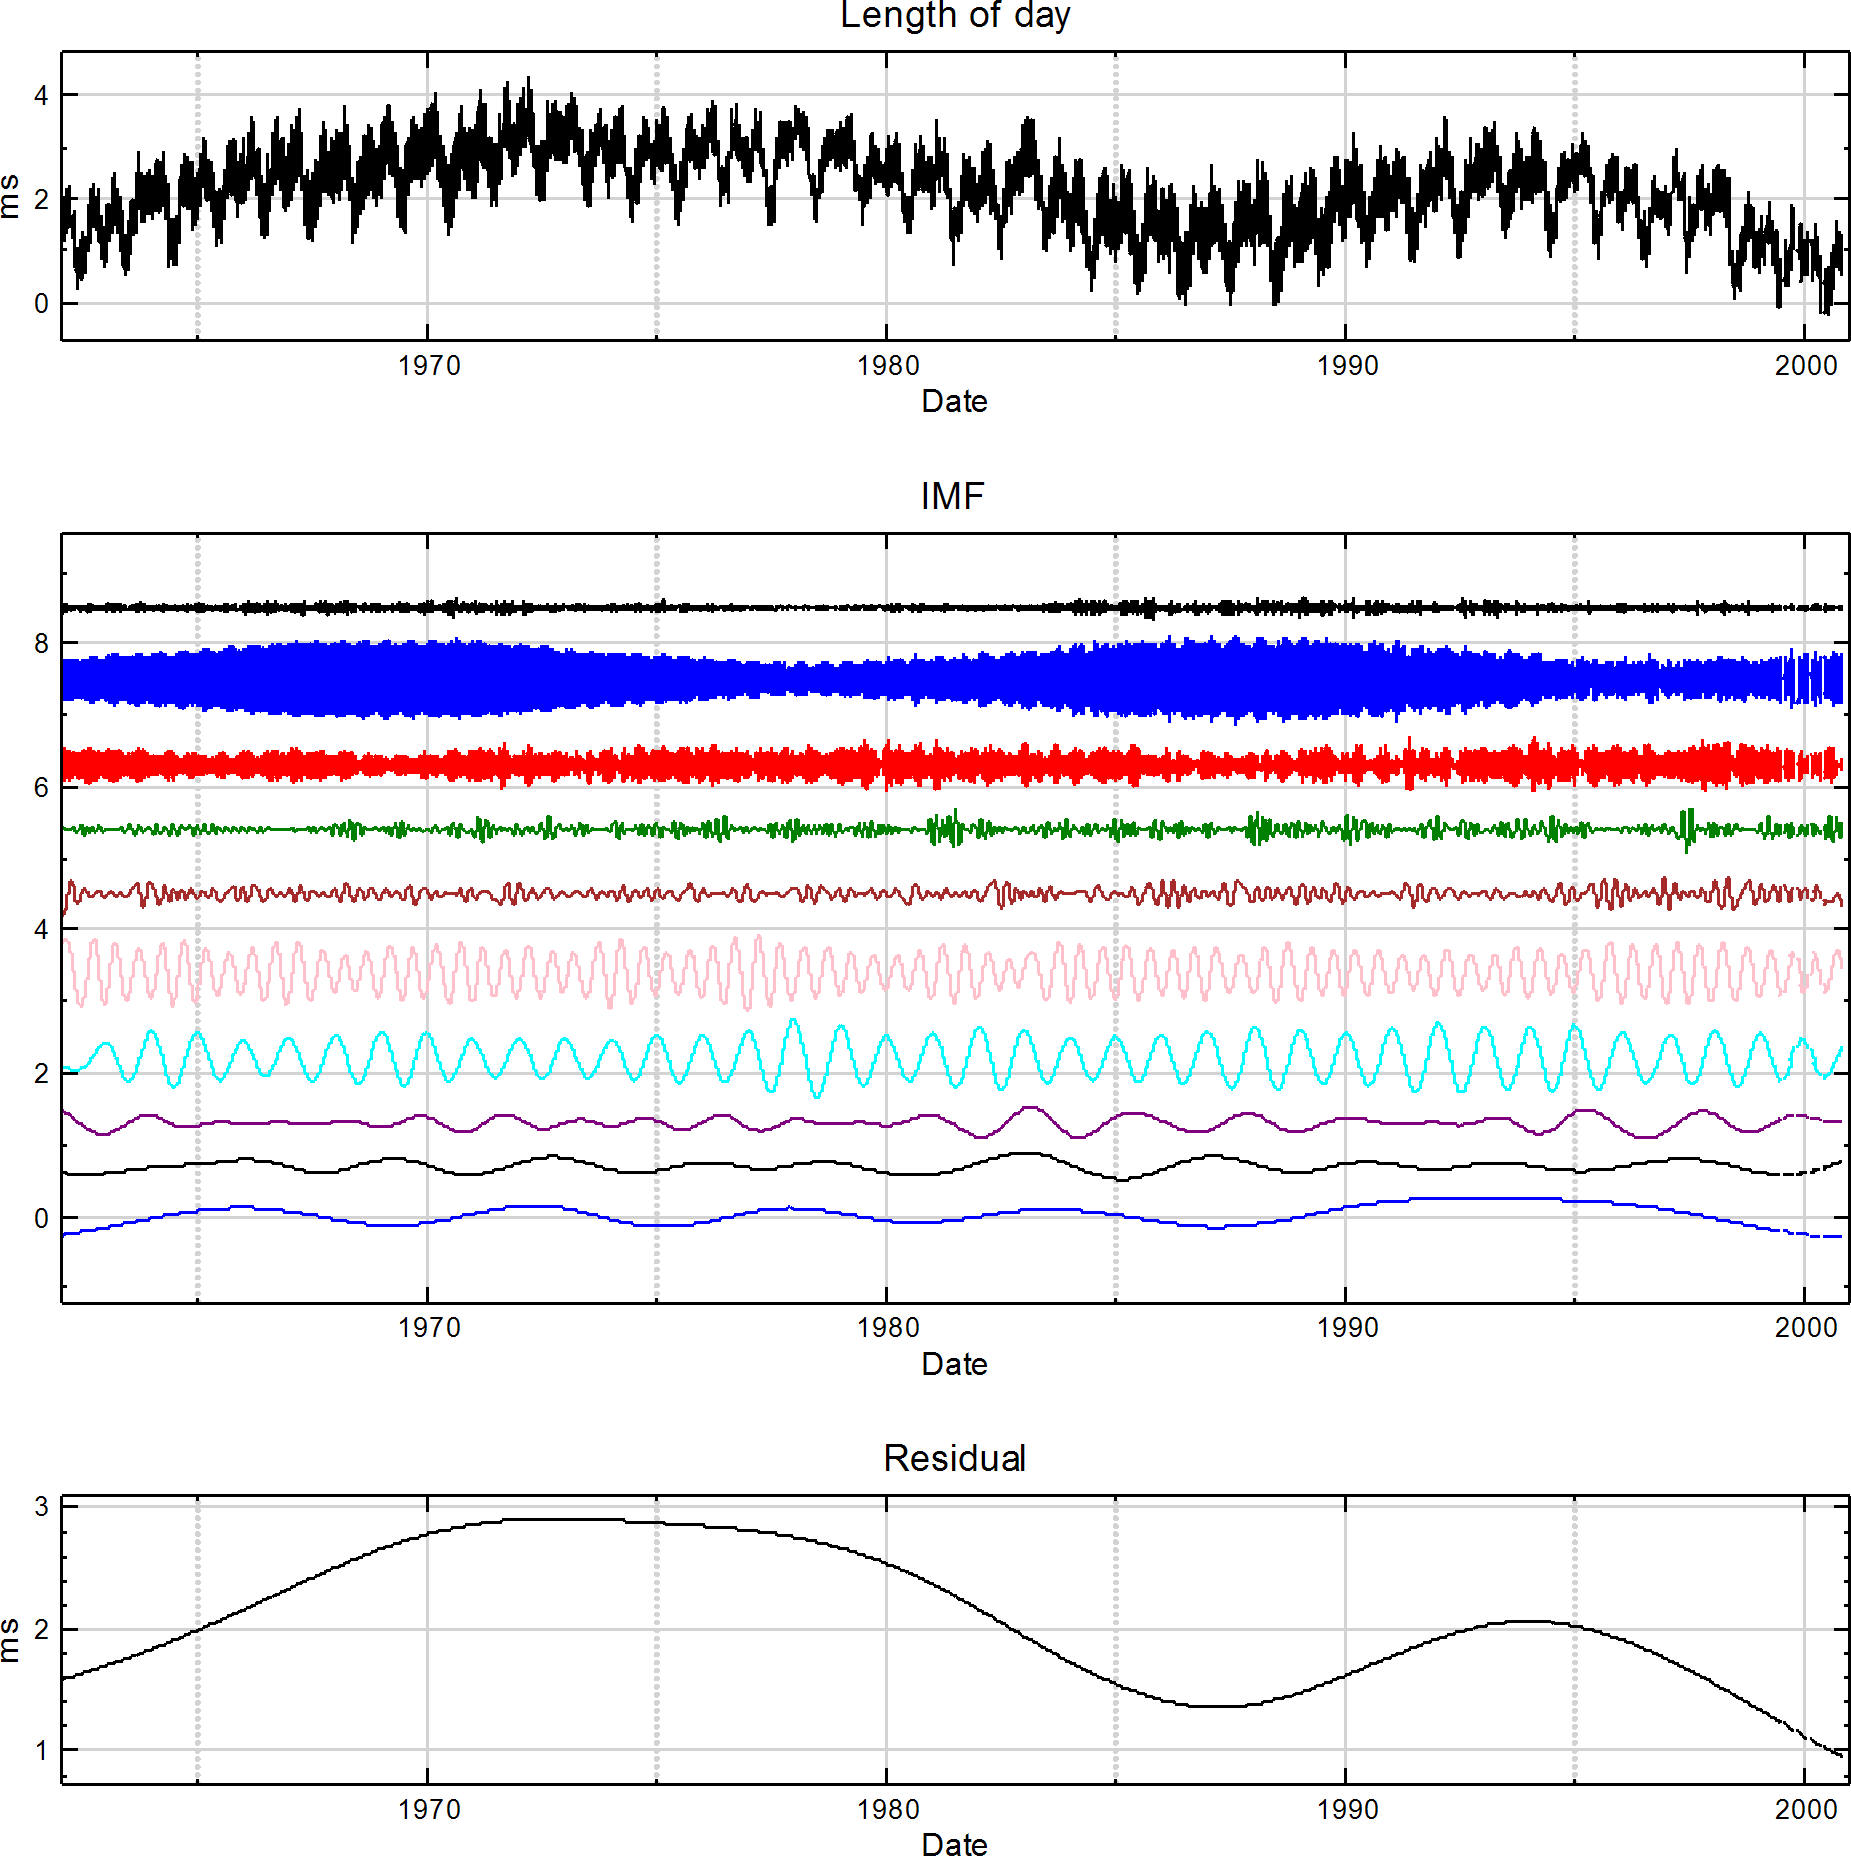
摘要:地物資料中,通常含有各種時間尺度的物理現象,涵蓋不同頻段、振幅與振動型態。如何在不扭曲,不改變本質振動型態情況下,分解出各不同時間尺度之資訊,一直是地物學者待努力之目標。HHT是近期發展之分析方法,可對於非線性與非穩態資料進行分析:
1.利用EMD為非線性時間域Filter特質,可以將不同時間尺度之訊號分開,易於作物理現象解釋,對於自然環境測定之資料有極佳的分解性能。且EMD具隨遇性(adaptive)基底之特性,對於資料內非線性的特性,做出不扭曲,不改變本質的呈現,還原自然現象的原貌。
2.趨勢(trend)可視為基線的跳動,也可視為總體動向的指標,找到跳動的基線才能確認跳動(variability)的大小,首先要定義趨勢與時間長度有關。借用EMD分解方法之隨遇性,可讓各種不同時間長度的跳動分解,而最長尺度之跳動即為趨勢。分解過程中不同時間長度之分項,即為待分析資料中內涵之本質(intrinsic)跳動。
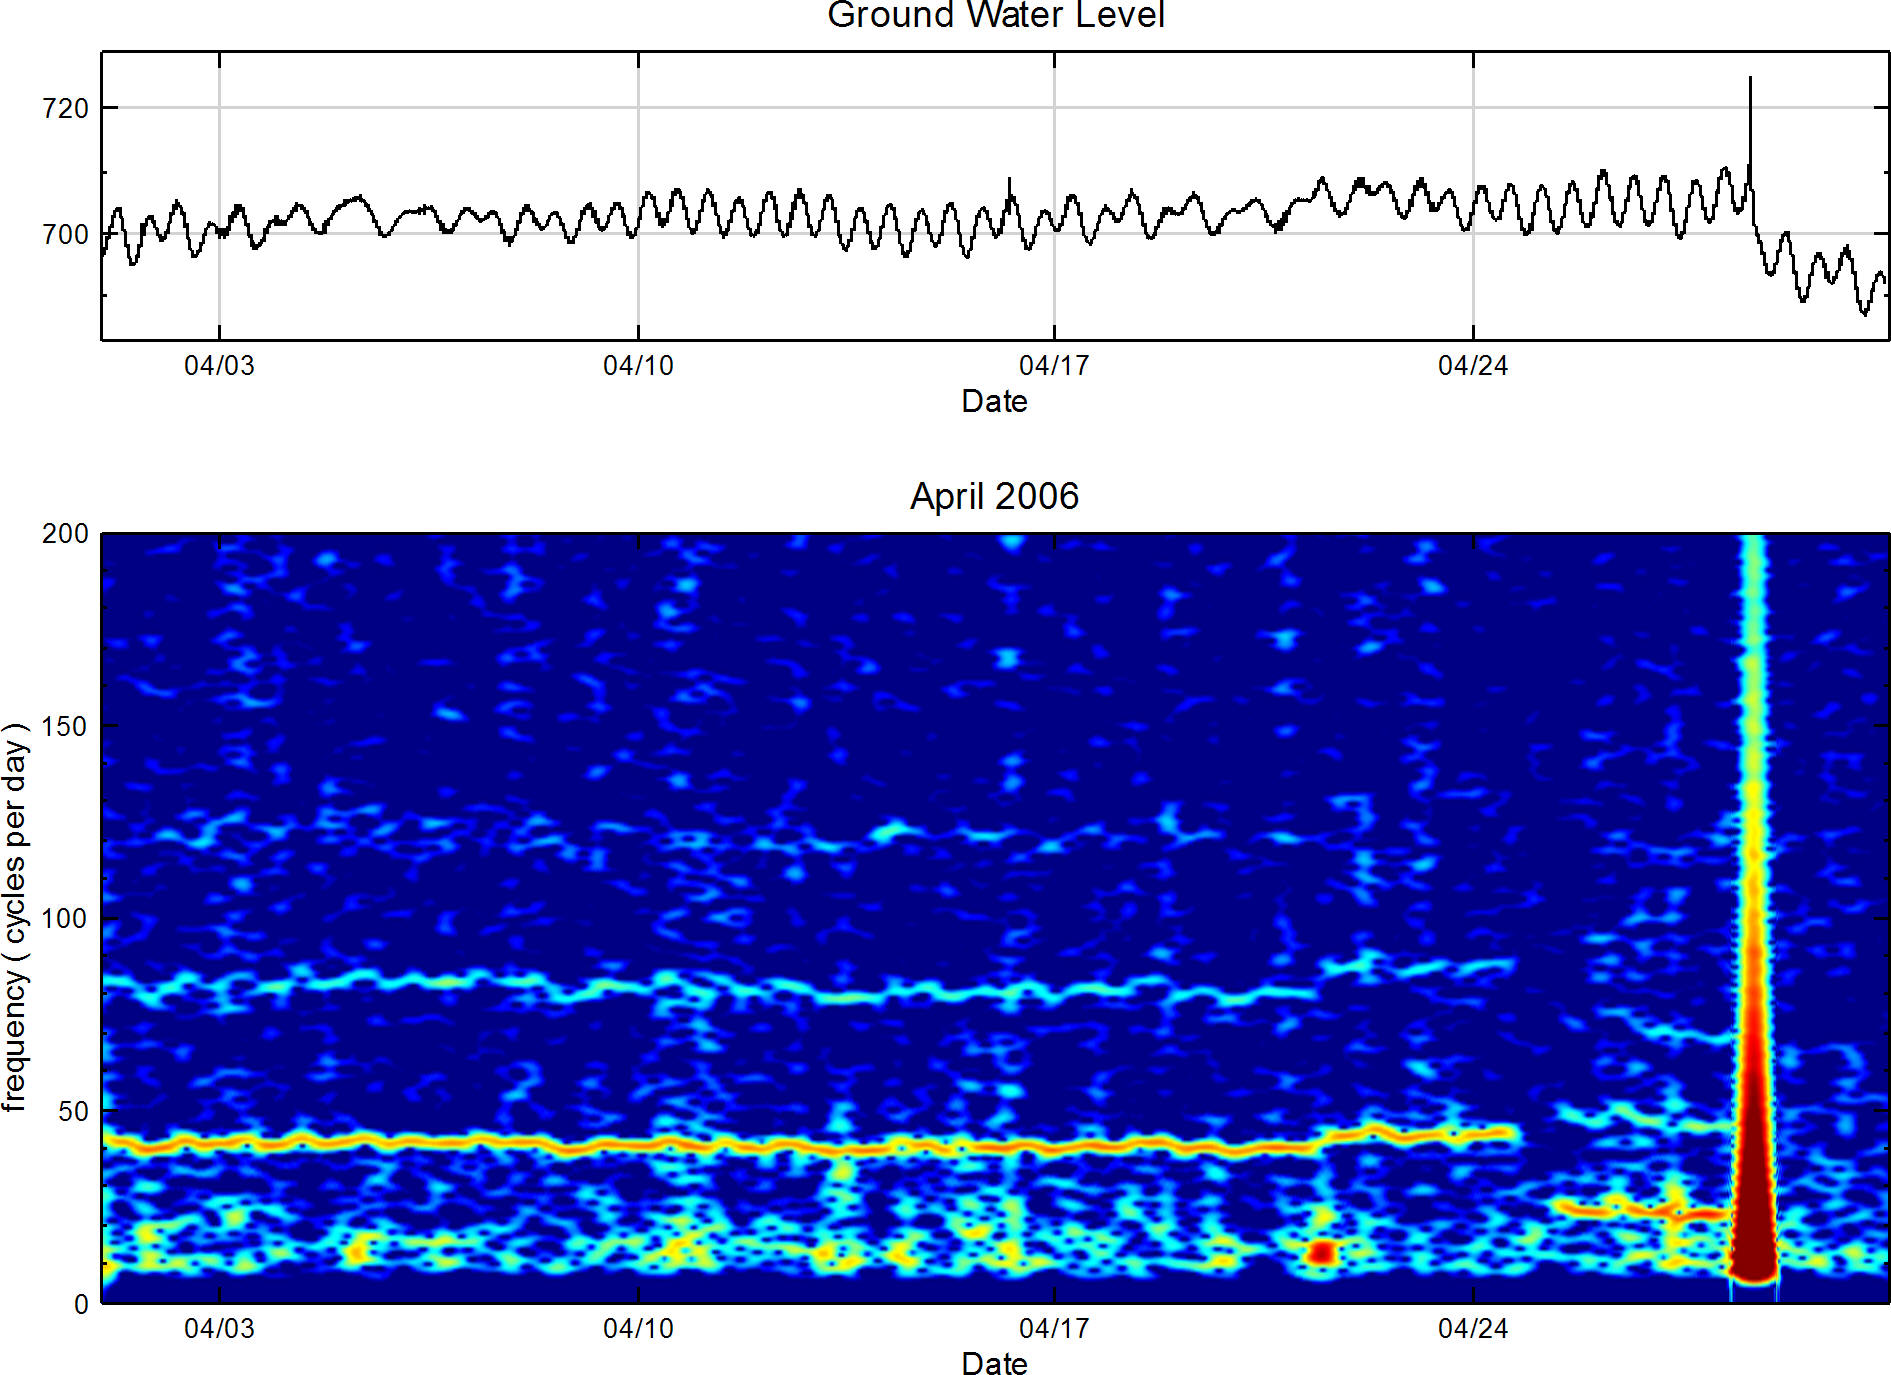
3.時頻譜(Time-frequency spectrum),可藉由EMD分析結果做希伯轉換(Hilbert Transform)將資料展現於時間-頻率座標上,表現出能量隨時間與頻率變化之關係進而顯現資料內部特性。進一步利用轉換函數(transfer function)之手法,將待定系統之輸入與輸出訊號加以比對,更可以明顯表現該物體物理特性。
本講以中央氣象局地下水觀測站資料來展現EMD之分解性能,並以中央氣象局結構物強震資料來展現時頻譜所表現之大樓特性,由實例分析來展示HHT之強大數值分析能力。
HHT分析方法介紹網頁: http://rcada.ncu.edu.tw/research1_clip_ex.htm
中央氣象局地震中心地球物理資料庫網頁: http://gdms.cwb.gov.tw:80/join.php
賴文基 組長,國立成功大學防災研究中心
講題:高頻地下水位紀錄中的動態響應分析
摘要:對於侷限含水層孔彈性力學參數及其地下水流性質的推估,除了透過現場的抽水試驗及實驗室內利用實驗直接量測方法外,利用高頻地下水位的觀測資料以及其對於地震、氣壓及地潮等較容易掌控的環境影響因素產生的動態響應,亦可間接推估較大尺度含水層的孔彈性力學參數及其地下水流性質等寶貴的資訊。由高頻地下水位紀錄藉由頻譜分析推估得出的水井-含水層系統水力參數,可避免室內實驗量測與現場實際情形的空間尺度效應,以及現場抽水實驗可能因為季節性影響、實驗設計及實驗條件受限造成無法充分反應現場特性的缺點。
鄭育能 博士,國立成功大學航空太空工程學系
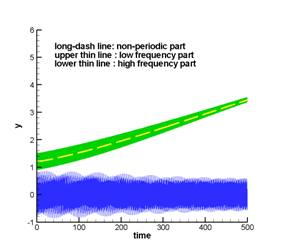
講題:Diffusive and fast filter for trend removal
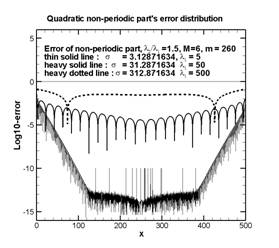
摘要:在複合數據串中的非週期趨勢線,對該數據的Fourier整個頻譜造成影響,影響頻譜或小波圖的判讀,也會使Hilbert-Huang 轉換求其局部極大極小點產生偏移,以致使得上下包絡線受到不當影響。本文介紹使用疊代式高斯濾波器或疊代式移動式最小平方誤差法,以分離出非週期趨勢線,使剩下的週期部份之頻譜、小波圖、Hilbert-Huang頻譜的可判讀性大幅度提升。本文以下面的例子說明濾波參數的影響,並顯示直接使用較大的參數值時,仍可保有1%左右的誤差水平。也以數個例子說明其應用。
胡植慶 博士,國立台灣大學地質科學系
講題:快速時頻分析在井下應變儀之初步研究
摘要:Project of monitoring of the fault activity using 3-component Gladwin Tensor Strainmeter (GTSM) was initiated by the Central Geological Survey of Taiwan in October 2003. These instruments are intended to supplement the deformation observations from the continuous GPS arrays as part of a systematic program of plate boundary observation across Taiwan orogenic belt. These instruments are installed at a depth of approximately 200 meters at 12 sites of 4 clusters which provide 3 component strain data on both crustal strain accumulation and transient strain variations induced by environmental change and earthquakes. At the beginning of data processing, the time series signal induced by environmental and tidal effects need to be separated in order to evaluate the strain rate change induced by tectonic activity.
Time series signal contains many physical as well as artificial components that can only be perceived
when separated. Generally signal is composed of four parts: trend, periodical, discontinuity, and stochastic
signals. Without interference, trend is better separated using zero phase filter like Iterative Gaussian
Smoothing Filter. Rather than spectrum analysis, periodical signal is better viewed in time-frequency plot
due to its time resolution. The showing of frequency changing with time in time-frequency plot in many
cases reveals abundant physical phenomena. However, due to various data acquisition conditions and
maintenance procedures, quality of data sometimes is degraded by lots of discontinuities, resulting in poor
time-frequency resolution and frequency contamination in spectrum analysis. In this presentation, several
approaches are explored to remove discontinuity. Examples including strain meter and ground water signals showing significant improvements both in spectrum and time-frequency analysis. |