*Only in Professional*
繪製方盒圖。
說明
Box Plot Viewer 是統計常用的一種繪圖方式。將一群組的數值以中位數、四分之一位數及四分之三位數為基礎,繪出一方盒,用連接至方盒的直線表示數列的極大值與極小值,藉以展現群組的統計資訊。
參數設定(Properties)
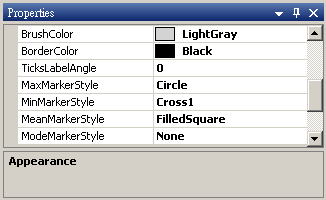
本模組接受實(real number)、複數(complex number),單通道(single channel)或多通道(multi-channel),regular或Indexed的訊號(signal)或聲音訊號(audio)輸入,且支援多個訊號連入。參數 Appearance 、Fontsand Colors、Grid、 Title 這些部分請參考 Channel Viewer,下面說明 Box Plot Viewer 所特有的參數。

BoxPlot Viewer 參數圖示
|
參數名稱 |
參數定義 |
預設值 |
|
BrushColor |
繪製方盒內部的筆刷顏色。 |
LightGrey |
|
BorderColor |
繪製方盒邊界的筆刷顏色。 |
Black |
|
TicksLabelAngle |
方盒圖下方標題文字排列的角度(degree)。 |
0 |
|
MaxMarkerStyle |
畫數列中最大值所使用的符號。 |
Circle |
|
MinMarkerStyle |
畫數列中最小值所使用的符號。 |
Cross1 |
|
MeanMarkerStyle |
畫數列中平均值所使用的符號。 |
FilledSquare |
範例(Example)
產生一個 Brownian Noise 與 CustomWave,用 Channel Viewer 繪出訊號後,再以 Box Plot Viewer 繪出兩訊號的方盒圖。
-
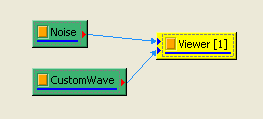
在 Source / Noise 建立一個雜訊 Noise,調整 Properties / NoiseType 為 Brown,接著在 Source / Custom Wave 建立一個 CustomWave,在 Properties / Expression 欄位輸入算式 sin ( 2 * pi * 10* t ) - 3 * pow ( t , 2),最後再將兩組訊號彙集於同一個 Channel Viewer 中,接著執行後會得到如下圖所示的結果。


-
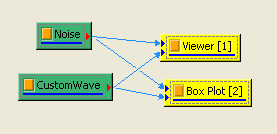
在 Viewer / Box Plot Viewer 建立一個 Box Plot Viewer,接著將 Noise 與 CustomWave 連入 Box Plot Viewer,即可畫出含有兩個方盒的方盒圖。


相關指令
TF Viewer,使用者介面,Map to Real。