It’s fast and easy to find your performance bottlenecks with a list of the most active functions. Click on a function name to display the source and show the most time-consuming source statements. |
See the Answers on Your Source
Source and assembly views show you exactly which lines of code are taking the most time.
|
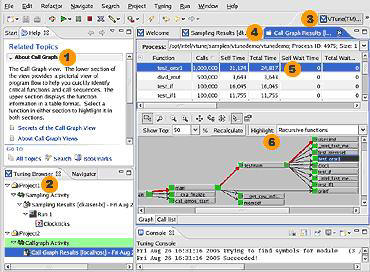
Find the Critical Path Using Call Graph Profiling
Call Graph determines calling sequences and graphically displays the critical path. It also shows you the context of the bottleneck. To be effective, you often need to know not only where the application is spending its time, but how it got there.
|
View the critical path in red
Quickly locate the critical path and navigate the profiling results easily using both a table and graph view. Click a table entry to highlight the function in the graph, or click the graph to find the table entry.
 |
| Unlike other offerings, VTune analyzer provides both sampling and call graph analysis. Even if you plan to do mostly call graph analysis, running sampling first lets you identify the modules that need it so you only pay Call Graph's larger overhead for the modules that need to be analyzed. This can be vital on large projects. Sampling is great for analysis of "loopy" code. Call Graph is usually better for "branchy" code. You need both to get the job done right. |
Low Overhead Sampling Profiling
Event-based sampling finds your bottleneck with very low overhead (typically less than 5 percent). Identify problems such as cache misses and branch mis-predictions. Because it is system-wide, event-based sampling can be used to tune libraries and drivers as well as application programs.
|
Filter the data to find your answers
The table and bar chart views of sampling results filter your data many different ways to find what you need. View by thread (shown) for load balancing.
|